Energy metering with ESP8266
Recently a new energy meter was installed in my home. The new meter is a so called Dutch Smart Meter which means as much as that it is
- a digital meter instead of the good old Ferraris meter,
- it will send its usage data to the network operator via GPRS and
- has a “P1” port which is just a regular RJ11/RJ12 socket over which it transmits using the DSMR protocol (v4.2 for my Kaifa 105c)
Knowing that it transmits live consumption I wanted to read this data, plot it and do all kinds of crazy analysis on it (like learning usage patterns so I can tell which device is on only from knowing the overall usage). To read the data I had access to a tiny ESP8266 model 01, or ESP-01 for short.
Hooking up the ESP was quite a challenge, for someone not used to soldering and working with electronic components, but the software part was easy. Let’s first explain the software.
The protocol is just an inverted serial signal, at 115200 baud, containing
- a header,
- data field names with corresponding values and
- a footer with CRC checksum.
Included in the data are current power usage, accumulated consumption split by day/night-tariff, and gas usage. A sample of the data:
/ISk5\2MT382-1000

1-3:0.2.8(40)
0-0:1.0.0(101209113020W)
0-0:96.1.1(4B384547303034303436333935353037)
1-0:1.8.1(123456.789*kWh)
1-0:1.8.2(123456.789*kWh)
1-0:2.8.1(123456.789*kWh)
1-0:2.8.2(123456.789*kWh)
0-0:96.14.0(0002)
1-0:1.7.0(01.193*kW)
1-0:2.7.0(00.000*kW)
0-0:17.0.0(016.1*kW)
0-0:96.3.10(1)
0-0:96.7.21(00004)
0-0:96.7.9(00002)
1-0:99:97.0(2)(0:96.7.19)(101208152415W)(0000000240*s)(101208151004W)(00000000301*s)
1-0:32.32.0(00002)
1-0:52.32.0(00001)
1-0:72:32.0(00000)
1-0:32.36.0(00000)
1-0:52.36.0(00003)
1-0:72.36.0(00000)
0-0:96.13.1(3031203631203831)
0-0:96.13.0(303132333435363738393A3B3C3D3E3F303132333435363738393A3B3C3D3E3F303132333435363738393A3B3C3D3E3F303132333435363738393A3B3C3D3E3F303132333435363738393A3B3C3D3E3F)
0-1:24.1.0(03)
0-1:96.1.0(3232323241424344313233343536373839)
0-1:24.2.1(101209110000W)(12785.123*m3)
0-1:24.4.0(1)
!F46A
When you have the data “telegram” you need to parse it, but luckily some libraries already exist: node-dsmr-parser for NodeJS for example. Just pass the data and get a object back:
const parser   = require('dsmr-parser');
const telegram = parser.parse(`\
/KFM5KAIFA-METER\r
\r
1-3:0.2.8(42)\r
...
!8A3F\r
\r
`);
console.log( telegram.objects );
Much of the data is constant however: the gas level is only updated every hour, and the aggregates might not increase every 10 seconds, depending on the usage. Thus some premature optimization could be applied here: I decided to do the parsing on the ESP, and only transmit changed data.
Luckily some existing projects do just that: I used https://github.com/renearts/ESP8266-P1-transmitter. Some small adjustments where necessary, which i will push to my fork at https://github.com/hermanbanken/ESP8266-P1-transmitter.
# The embedded software
Flashing the ESP-01 is not just plug and play, as there is no USB port and or controller build in. You need to have a FTDI cable, or use another board (I used an Intel Edison) to directly communicate over serial. There are many many guides online how to connect the ESP so I will leave the schematics to be searched on Google.
Once you have a working serial connection you can flash the ESP by pressing the RST and FLASH buttons. Hold one, click the other. I can never remember which one you need to hold… A nice tool I used was PlatformIO, which provides an IDE, bootloaders, configurations for many boards and a button to compile and upload. In the end it is just like Arduino IDE, but having a better editor. I followed the instructions to install it from https://youtu.be/lXchL3hpDO4 while researching OTA updates. Their site, to download the IDE from, is http://PlatformIO.org.
After flashing the ESP and attaching it to the meter it now sends an update to a pimatic server, or any other server listening at /api/variables/_id_ for JSON data.
The hardware
To me this was the challenging part. I had just ordered a soldering iron. I know the basic workings of components like resistors, but things like the difference between NPN and PNP, BJT and FET transistors was new to me. A challenge!
Required components to build/get:
- ESP
- signal inverter
- RJ12 cable & header, make sure it has 6 wires or you need an external power source
- Power regulator for 5V to 3.3V
- Supercapacitors (found this out after the second build)
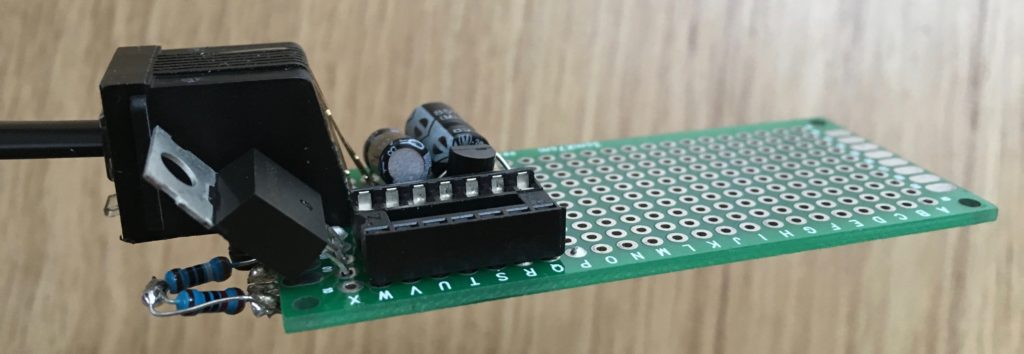
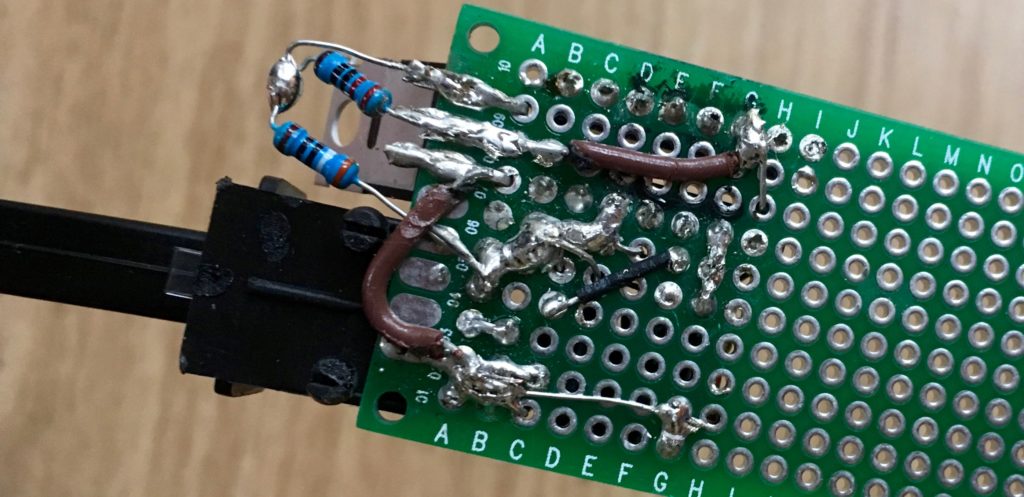
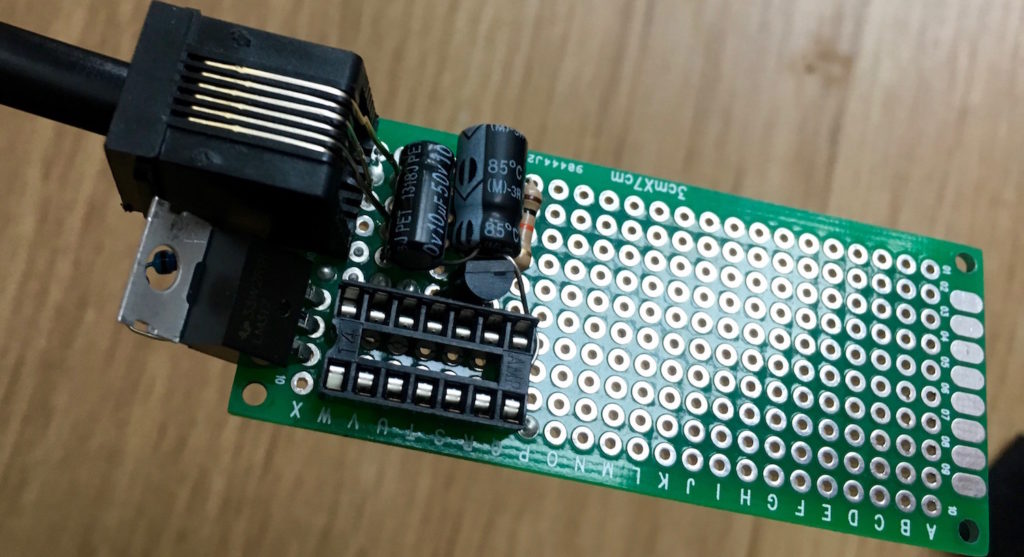
The inverter and the power regulator
The result: